This edition of Modern Restaurant Management (MRM) magazine’s Research Roundup features how AI is influencing where people choose to dine, up-and-coming coffee brands, and coffee and burger loyalty.
Career Opportunities in Restaurants
New research from the National Restaurant Association finds that restaurant employees overwhelmingly see the industry as a place to build skills, advance professionally, and pursue meaningful long-term careers. In fact, among current employees working their primary job in the industry, 89 percent feel there’s an opportunity for career advancement and 96 percent are satisfied with their industry work experiences.
Made in Restaurants: Industry Careers in America draws on national surveys of current restaurant employees, former restaurant employees, and adults who have never worked in the industry. The findings show that people with firsthand restaurant experience say they have developed durable skills, see multiple paths to advancement, and have opportunities that extend well beyond short-term and first jobs.
Among current restaurant employees working their primary job in the industry, 86 percent say they are likely to continue working in the restaurant and foodservice industry until retirement. Ninety-one percent would recommend a restaurant job to a friend or family member.
The report also identifies a perception gap around restaurant experience – with those who have restaurant experience having more positive views of the work than those who have not. While 86 percent of current restaurant employees say the industry provides good long-term career opportunities, just 54 percent of adults who have never worked in restaurants agree. Similarly, 90 percent of current employees say work in a restaurant is a good job, compared with 65 percent of people without industry experience.
The perception differences are especially evident in how respondents view workplace challenges. Adults who have never worked in restaurants were more likely than current employees to identify schedules, compensation, and being treated with respect and dignity as challenges. Specifically, 53 percent of people without restaurant experience cited schedules as a challenge, compared with 29 percent of current employees; 50 percent cited compensation, compared with 28 percent of current employees.
Career Pathways and Transferable Skills
One finding is that the workforce sees real mobility. Among current employees working their primary job at a restaurant, 89 percent feel they have the opportunity for career advancement in the restaurant industry. Among those, 48 percent see it with their current restaurant employer, 10 percent see it with another industry employer and 42 percent see opportunity with both. Among current employees working their primary job at a restaurant, 42 percent say they would like to own or operate a restaurant someday.
Restaurant work also builds skills that people carry throughout their careers. Eighty-two percent of current employees say restaurant jobs prepare people for success in whatever jobs or careers they pursue. Respondents identified teamwork, work ethic, customer service, time management, adaptability, communication, leadership, and problem-solving among the skills developed through restaurant work.
AI Influence
AI is changing how diners find places to eat and opening a new path to visibility for independent businesses, according to Menufy.
The survey found that 80 percent of consumers would try an independently owned restaurant they had never heard of if it were recommended by AI. Consumers also see a clear advantage for local discovery, with 78 percent saying AI makes locally owned restaurants easier to discover compared with national chains. Together, the findings point to AI as a new visibility channel that could help independent restaurants get in front of consumers beyond traditional search habits.
AI is already influencing where consumers eat
Restaurant discovery through AI is already part of how many consumers decide where to eat. Sixty percent say they use AI-powered tools such as ChatGPT, Gemini, Google AI Mode or Perplexity to help make that decision, while another 19 percent have not used AI this way yet but would consider it. That use is translating into real restaurant visits and orders, with 35 percent saying an AI recommendation introduced them to a restaurant they had not previously heard of and they went on to visit or order from that business. Another 14 percent discovered a new restaurant through AI without ultimately placing an order or visiting.
Consumers also see AI as useful across a range of dining decisions. More than half (54 percent) would use it to find restaurants nearby, while 31 percent would use it to search for a specific cuisine or dish and 30 percent would turn to AI when looking for restaurants in a new city. The results show how conversational search can help consumers narrow a broad set of choices around the details that matter to a particular meal or occasion.
Independent restaurants have an opportunity to reach new diners
This is where smaller, independently owned restaurants have an edge. Among respondents, 76 percent said they would be likely to try a local restaurant recommended by AI, compared with 65 percent who said the same of a national chain. The gap shows AI can help diners look beyond the familiar brands that often come to mind first and consider local options they may not have otherwise found.
AI is also gaining credibility alongside established restaurant discovery sources. Sixty-four percent of consumers trust AI restaurant recommendations at least as much as traditional Google Search, and 59 percent trust AI at least as much as Google Reviews. Personal recommendations remain particularly influential, with 59 percent saying they trust friends or family more than AI. This suggests AI is becoming an increasingly credible part of the decision process, alongside sources consumers already use when choosing where to eat.
Digital fundamentals still help turn discovery into an order
While independent restaurants and smaller chains have a real opportunity to win when it comes to AI search and discovery, AI is only one piece of the pie. For most consumers, it serves as a starting point before they take additional steps to validate whether a restaurant is right for them. Only two percent of consumers say they would order from an unfamiliar restaurant recommended by AI without checking another source first. Instead, 54 percent would review menu information and prices, 48 percent would check customer ratings and reviews, and 47 percent would visit the restaurant’s official website before deciding whether to order.
For independent restaurants, that behavior raises the stakes for the digital information consumers encounter after an AI recommendation. Up-to-date menu information and a credible restaurant website can help validate what a diner has already learned and give them confidence to move forward with an order.
The survey was commissioned by Menufy and conducted by Dynata, in September 2026 of 1,000 U.S. consumers 18 years and older to understand how consumers use AI to discover restaurants.
College Students and Fast Food
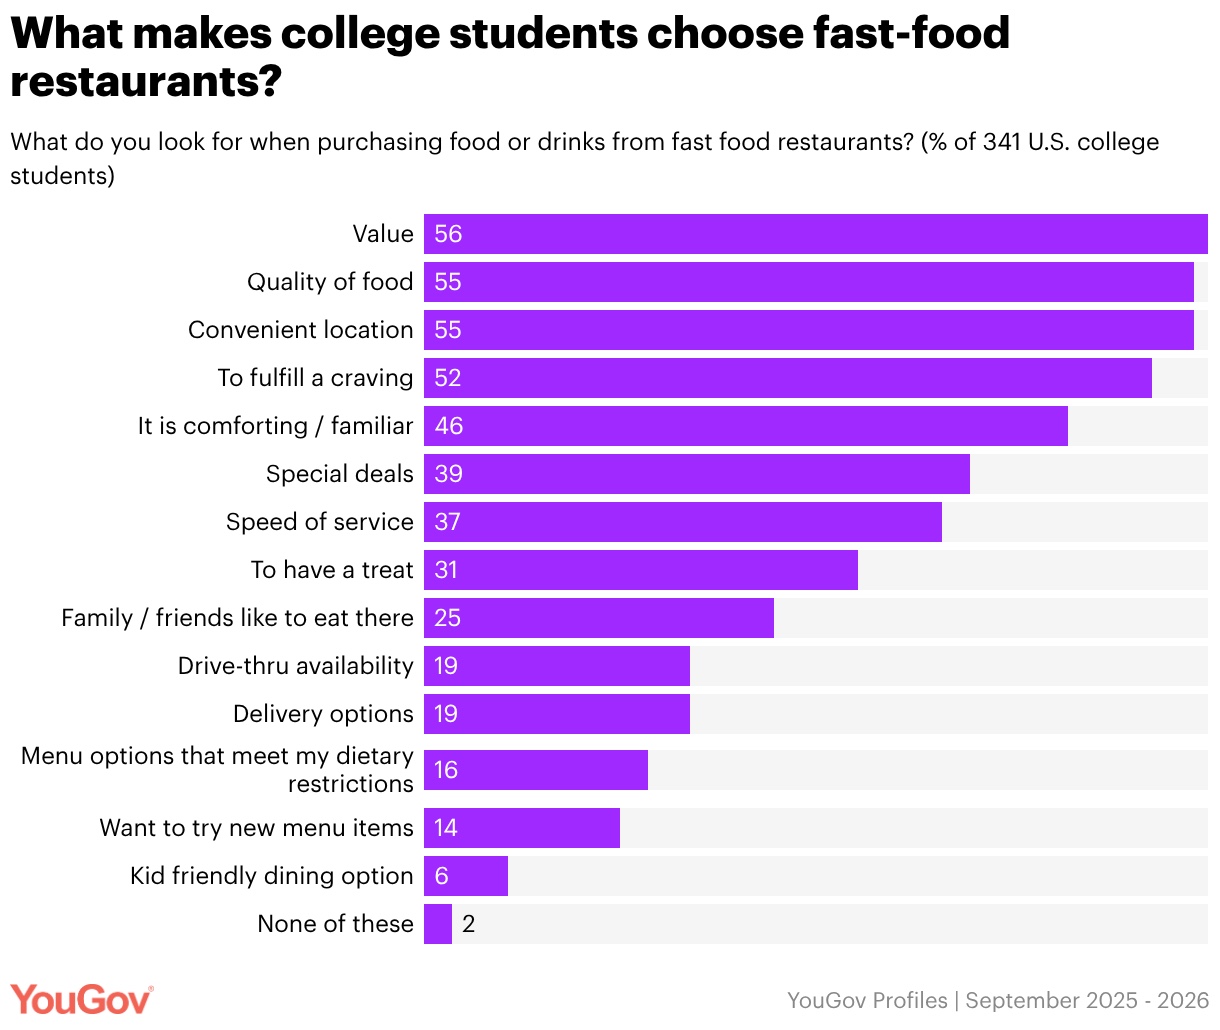
New YouGov analysis finds 69 percent of US college students say high prices could deter them from visiting a fast-food restaurant, while value, food quality and convenience are nearly equally important in choosing where to eat.
Key findings:
- Price is the biggest potential barrier: High prices could put off 69 percent of students, followed by poor value for money (64 percent).
- McDonald’s leads consideration at 47 percent, ahead of Chick-fil-A, Domino’s and Wendy’s, each at 34 percent.
- Different brands win on value and quality: Domino’s has the highest net Value score (28), while Chick-fil-A leads on net Quality (38).
- Mobile apps are the most common ordering method (54 percent), ahead of counter and drive-through ordering (45 percent each).
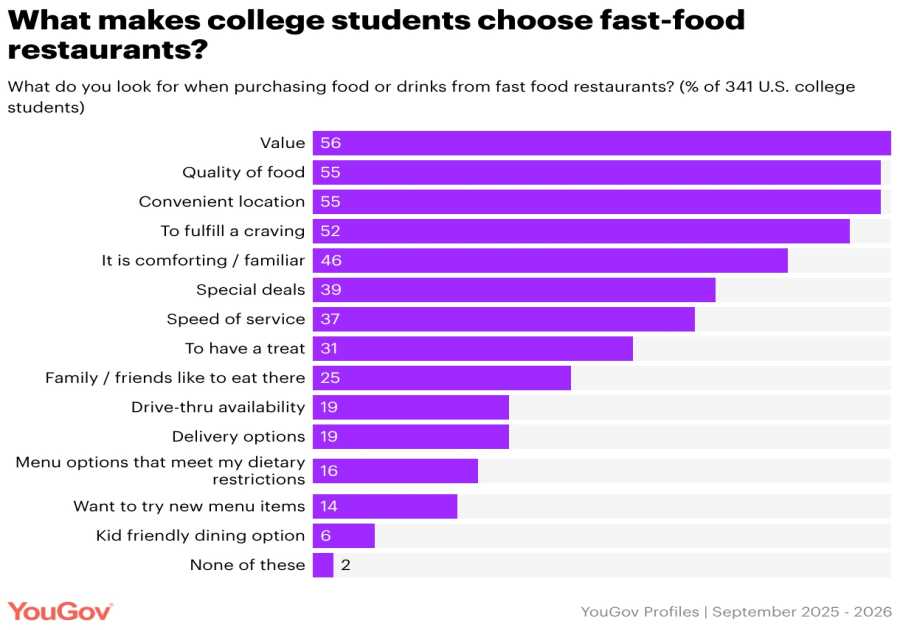
- Value narrowly leads purchase drivers: 56 percent cite value, closely followed by food quality and location convenience (55 percent each).
The findings draw on YouGov BrandIndex and Profiles data and offer a look at what wins college students’ fast-food business—and what could send them elsewhere.
Top Brand Experiences
In the restaurant category, In-N-Out held onto the top spot for the second consecutive year, followed by Texas Roadhouse at No. 2, according to ChangeUp’s 2026 Experience Report, that identifying the Top 100 brands based on how strongly their physical experiences resonate with customers.
ChangeUp surveyed more than 6,500 consumers across 300+ brands, capturing more than 400,000 data points through large-scale survey research and AI-powered sentiment analysis of consumer reviews and online conversations. As it did in 2025, the brands were evaluated across eight key dimensions of experience: Memorability, Staleness, Return Intent, Unprompted Visit Desire, Advocacy, Novelty, Substitutability, and Relevance.
Across the Top 100 brands, the strongest perform across multiple dimensions, not just one. Costco, H-E-B and Fleet Feet score above the retail average on nearly every dimension. In restaurants, brands like In-N-Out, Chick-fil-A, Playa Bowls, and Texas Roadhouse turn distinctive elements into signature experiences that customers remember and talk about.
Brewing Up Traffic
Watch out, Starbucks and Dunkin’: New competition is brewing. A new report from Placer.ai shows that 7 Brew Coffee and Scooter’s Coffee — two growing coffee upstarts — are seeing significant foot traffic growth.
Here are some takeaways:
Foot traffic increases: Between January and August 2026, overall foot traffic grew a whopping 41.6 percent at 7 Brew compared to the same period in 2025. At Scooter’s, it increased 6.1 percent.
Catering to similar bases: The two chains have similar physical footprints (7 Brew has 800 stands in 38 states, while Scooter’s has 920 locations in 32 states) and share commonalities in their customer base.
Differing strategies: Data shows that Scooter’s tends to attract more morning customers with its breakfast foods and beverages, while 7 Brew brings in more during the afternoon and evening, with smoothies and energy drinks.
Tipping Index
Toast released its latest Restaurant Tipping Index Report, offering an updated look at how tipping behavior across the U.S. performed in Q2 2026.
TL;DR: The overall average restaurant tip across the U.S. held steady at 18.8 percent. Full-service restaurant (FSR) tips dipped back to 19.1, while quick-service restaurant (QSR) tipping remained flat at 15.8 percent. Regionally, Delaware continues to lead the nation in total tipping, while California ranks lowest.
Q2 2026 Tipping Index highlights include:
🍷 Full-Service Restaurant (FSR) Tips: The average FSR tip has dipped back to 19.1 percent in Q2 2026.
⚡ Quick-Service Restaurant (QSR) Tips: Quick-service tips remained flat at 15.8 percent, marking several consecutive quarters of unchanged tipping rates in counter-service settings.
📦 Takeout Tipping: Guests tipped an average of 13.8 percent on takeout transactions where a gratuity was added.
📍 Best State for Tipping: Delaware took the top spot nationwide with an overall average tip rate of 21.4 percent (and 21.8 percent at full-service spots).
📍 Lowest Tipping State: California stayed at the bottom of the list with an overall average tip rate of 17.1 percent (17.6 percent at FSRs).
❤️ The “Regulars” Effect: A survey of frequent diners shows 77 percent of respondents leave larger tips when visiting spots where they are regulars, with nearly half leaving an extra 10 percent–15 percent above their usual gratuity.
Toast also released its August Menu Price Monitor, offering a granular view of how inflation is impacting restaurant menus.
TL;DR: August data shows that in the midst of peak iced coffee season, the price of cold brew rose to a high of $5.66, even as the price of drip coffee steadied month over month. Meanwhile, as the dog days of summer come to a close, frankfurters were the only item to see prices decrease.
August Menu Price Monitor highlights include:
🍳 Omelette remains flat: The median price of an omelette remained flat at $15.02, up 0.1 percent from July 2026 and up 1.8 percent since August 2025.
🌭 Hot dogs are down: Hot dogs were the only items to drop in August, with the median price falling 0.6 percent to $7.69, though still up 3.2 percent since August 2025.
☕️ Coffee steadies: The median drip coffee price has remained flat at $3.77 (an all-time high) since July 2026, but is up 7.1 percent since August 2025.
🧊 Cold brew prices increase: The median price of cold brew rose to $5.66, up 0.7 percent since July 2026 and 3.5 percent since August 2025.
🍔 Slight sizzle in burger prices: The median price of a burger was $14.77, up 0.3 percent since July 2026 and up 2.1 percent since August 2025.
🍗 Chicken wing prices warm: Despite a drop in July 2026, chicken wing prices rose in August by 0.3 percent, bringing the median price to $13.90 and up 0.8 percent since August 2025.
🌯 Burritos hold steady: The median price of a burrito rose to $13.69, up 0.1 percent from July 2026 and up 2.3 percent since August 2025.
🍻 Beer prices increased slightly: The median price of a beer was $6.62, up 0.2 percent from July 2026 and up 2.3 percent since August 2025.
Importance of Loyalty
Just more than 60 percent of first time coffee guests return for a second visit, according to the Paytronix 2027 Coffee and Cafe Loyalty and Industry Insights report, which provides insights into how growing coffee and café brands are using loyalty, mobile ordering, and guest data to increase repeat visits and become part of their customers’ daily routines.
The Paytronix report finds that the average guest belongs to 19 loyalty programs but is only active in nine of them. Keeping their attention, not enrollment, is the main factor in driving visits.
The report also finds:
- 59 percent of coffee transactions happen at a drive-thru and 38 percent happen through an app, meaning close to 4 in 10 of all transactions are already tied to a channel that can feed a loyalty program, if systems are actually connected.
- Fast-growth chains like 7 Brew, Foxtail Coffee, and Wake Up Call Coffee are proving that a simple, high-frequency loyalty mechanic paired with mobile ordering beats menu innovation every time.
- 60.2 percent of first-time guests return for a second visit, the strongest second-visit conversion of any restaurant segment Paytronix tracks.
- 87.3 percent of guests who reach nine visits go on to a 10th, proof that once a coffee guest builds the habit, they stay
Support for Small Businesses
New data from Kurv shows consumers may be more willing to absorb these costs than merchants think, especially to support small businesses during the holiday weekend.
Here’s what we found:
- Consumers are rooting for local businesses: 65 percent of shoppers say they’re willing to pay a convenience fee to support a local business over a national retailer, and most say they’d complete their purchase as planned (51 percent) rather than walk away.
- Gen Z is leading the shift: Gen Z shoppers are the most willing of any generation to absorb a convenience fee to support small businesses over national retailers (74 percent vs. 65 percent overall), and they complete purchases as intended at a higher rate too (59 percent vs. 51 percent overall).
- The fear of losing customers may be overblown: When faced with a small convenience fee at checkout, 51 percent of consumers would still complete their purchase as planned.
Since 53 percent of small businesses say inflation is their biggest concern, merchants are feeling pressure to protect their margins, and Labor Day discounts make this even harder.
Whose Cheeseburger Is It?
Simpli.fi, released “Whose Cheeseburger Is It?“, the first edition of the Loyalty in the Real World report series. In celebration of National Cheeseburger Day (September 18), Simpli.fi analyzed a sample of hundreds of thousands of visitors to the top-20 U.S. burger-focused QSR chains across 20 metro markets over eight weeks, and identified which brands are leading by foot traffic volume and loyalty patterns.
The study reveals that burger QSR visitors are loyalists, with 61 percent exclusively loyal to one brand. Few organizations can boast that kind of customer buy-in, but 39 percent of QSR customers are available to convert into loyalists.
In a battle of the buns, “Whose Cheeseburger Is It?”
- Shake Shack hit a remarkable 99 percent loyalty rate, where only 1 percent of its customers visited a rival burger chain during the same timeframe. Wendy’s, Smashburger, Sonic and Steak ‘n Shake round out the top five. The throughline connecting these brands is that each one offers signature items, such as a Frosty, that don’t have a close competitor from other brands. Switching brands is less likely to happen when customers feel there is only one place to get what they’re looking for.
- McDonald’s is the top competitor to every other brand in the study. While the fast food titan only hits a 60 percent loyalty rate, it shares significant visitor overlap with all the other leaders in the pack, suggesting it is particularly well positioned to win loyalty from consumers who cross-shop across the category.
- A&W and Dairy Queen were two of the top-three brands with “samplers”, customers who visit multiple locations, rather than “dedicated loyalists”, customers who stick to one chain. Burgers for these brands are secondary items to their core treats, which may help explain their higher rate of sampling when it comes time to grab a cheeseburger.
- Whataburger is a prime example of a brand navigating rapid expansion, where growth into new markets has coincided with a higher rate of cross-shopping and the second-highest rate of samplers (52 percent).
With the exception of Shake Shack, the report finds that every brand has an opportunity to grow that loyal base by:
- Defending the loyalists: Leverage first-party loyalty data to target existing customers with dedicated budget while suppressing them from acquisition campaigns.
- Expanding into new meal times: Use daypart and foot-traffic data to identify occasion gaps and serve targeted creative to commuters moving through specific trade areas.
- Focusing on winning the rivalry: Geofence competitor locations to identify active visitors, then use offline retargeting across devices to win over switchers and defend wavering regulars.
- Scaling to every location: Centralize brand guardrails, creative assets, and budgets on a single platform that lets local franchise owner/operators deploy localized campaigns in minutes.
- Measuring what moved: Track real-time foot traffic and revenue attribution across screens to optimize budget allocation while running campaigns.
Best of the Best
Tripadvisor announced the winners of its annual 2026 Travelers’ Choice® Awards: Best of the Best Restaurants, representing the top one percent of all listings worldwide based on real diner reviews.
Claiming the title of the No. 1 Fine Dining Restaurant in the world is Fogón Asado in Buenos Aires, Argentina. Celebrated for its intimate, interactive asado tasting experience, the restaurant reimagines traditional Argentine barbecue by seating guests around an open kitchen where chefs prepare an elevated multi-course dinner paired with local wines.
This year’s awards also introduce four new experiential categories centered on food adventures: Food Tours, Cooking Classes, Wine & Beer Tours, and a Viral Right Now category recognizing the world’s top trending foodie sensations.
The World’s Top 10 Fine Dining Restaurants:
1. Fogón Asado – Buenos Aires, Argentina
2. KOMA Singapore – Singapore
3. The Rhythms Restaurant – Hanoi, Vietnam
4. The Witchery Restaurant – Edinburgh, United Kingdom
5. Meat Market – Valencia, Spain
6. Abrasado – Guaymallen, Argentina
7. Catherine Gramado – Gramado, Brazil
8. Careyes restaurant – Cancun, Mexico
9. Acre – San Jose del Cabo, Mexico
10. El Mercado – Buenos Aires, Argentina
The World’s Top 10 Food Tours:
- Reykjavik Food Walk – Local Foodie Adventure in Iceland – Reykjavik, Iceland
- Undiscovered Lisbon Food & Wine Tour by Eating Europe – Lisbon, Portugal
- Amsterdam Food and Cultural Tour with 10 Tastings – Amsterdam, The Netherlands
- From Split: Krka Waterfalls, Food & Wine Tasting Tour – Split, Croatia
- Rome Twilight Trastevere Food Tour by Eating Europe – Rome, Italy
- Hungry Osaka Street Food Tour: 15 Tastings & 3 Drinks with a Local – Osaka, Japan
- From Barcelona: Half-Day Montserrat, Tapas & Wine Tour – Barcelona, Spain
- Greek Food Walking Tour in Athens – Athens, Greece
- Devour Paris Ultimate Food Tour – Paris, France
- Lima Ultimate Peruvian Food Tour – Lima, Peru
Global Flavors Go Mainstream
Global flavors have moved from niche to mainstream, and with that a proliferation of copycats hit the market quicker than ever. New research from Curion, finds that consumers in the long term are choosing the brands they trust to deliver an authentic, quality product. And it’s not just the taste of the product that counts, it’s the story of how it first materialized, where it’s coming from, how it’s produced, and how it’s positioned.
In a Curion Poll PULSE survey of more than 15,000 U.S. adults, 87 percent of Gen Z are most likely to reach for a brand that puts cultural acknowledgements first, by sourcing ingredients from the origin country as a highlight of quality, honoring the history of the product while layering in their own storytelling, and striving to taste authentic. Meanwhile only 5 percent of Gen Z and 8 percent of all surveyed adults mention they’d rather brands sacrifice authenticity to make themselves more palatable to a wider audience.
The survey also found 53 percent said they had eaten a “Dubai-style” chocolate bar — the chocolate, pistachio and crisped-kataifi confection popularized by Fix Dessert Chocolatier — in the past year. Five years ago, just 22 percent reported regularly eating treats built on that same flavor combination. The category has more than doubled in under five years, and it is not alone: matcha (44 percent) and boba, or bubble milk tea (48 percent), each reached a broad share of consumers in the past year after a decade of steady growth.
What actually convinces a consumer to try
Asked what would convince them to buy a new product with globally inspired flavors, consumers pointed to the product itself, not the marketing around it. The strongest drivers were a product that strives to taste authentic (53 percent), one that highlights the quality of its ingredients (43 percent), and one that sources ingredients from the country of origin the product is tied to (41 percent). Honoring the product’s cultural history (35 percent) and explaining the inspiration behind it (33 percent) followed close behind.
Celebrity, influencer, chef and food-blogger promotion ranked at the very bottom of the list, named by just eight percent — meaning authentic taste swayed consumers nearly seven times as often as a celebrity or influencer endorsement. Only 12 percent said they would want a brand to adapt a flavor for a wider audience at the expense of authenticity.
Consumers investigate before they buy
Consumers are also more deliberate about trends than the pace of social media might suggest. Only 14 percent said they ignore cultural food trends. Far more engage actively: the most common posture was comparison shopping, with 40 percent seeking out several brands’ versions of a trending product to compare. Roughly a third said they search out the original product that started the trend (32 percent), try a single version to satisfy their curiosity (32 percent), or research which brands are most authentic to a product’s origins (30 percent). About one in four (27 percent) said they look into a product’s cultural background whether or not they end up buying it.
Two roads into a trend
Curion’s analysis frames a choice every brand face when a global flavor goes viral. A trend-forward approach chases the flavor quickly, substitutes ingredients when supply tightens and leads with aesthetics. This is a path that can win the launch. A cultural-stewardship approach sources from the origin, discloses it, partners with originating producers and leads with heritage marks a slower path that tends to win over the consumer year after year.
The decision about what path to take is real. Surging demand has strained supply chains, from a widely reported pistachio shortage tied to the “Dubai-style” chocolate boom to pricing and availability pressure on Japanese matcha. But the research suggests brands that treat a trend as a durable category, rather than a limited-time novelty, are better positioned as a flavor moves from new to normal.
The brands that are still selling when a global flavor stops being novel are the ones that did the work up front — understanding where a flavor comes from, sourcing it with integrity and telling that story honestly.
What it means for brands
The findings point to a clear playbook for brands weighing whether and how to enter a global-flavor trend:
● Treat the flavor as a category, not a limited-time offer. Consumption of established global flavors keeps climbing year over year; the durable opportunity is in staying, not sprinting.
● Lead with the product. Authentic taste and ingredient quality are what move consumers to try — well ahead of influencer or celebrity promotion, which ranks last.
● Build cultural credibility into the product, not the footnote. Sourcing from the origin, honoring the history and explaining the inspiration all rank among the top reasons consumers say they would buy.
● Source from the origin region where feasible. It strengthens both supply-chain resilience and premium positioning as demand grows.
“The brands that win the next chapter of this category won’t be the ones with the loudest launch,” Issabelle added. “They’ll be the ones that pair trend velocity with authentic sourcing and storytelling — so a first purchase becomes a habit.”
Best Cities for Vegans and Vegetarians
With Oct. 1 being World Vegetarian Day, Nov. 1 being World Vegan Day, and meat prices getting hit much harder by inflation than fruit and vegetable prices, the personal-finance company WalletHub released its report on 2026’s Best Cities for Vegans & Vegetarians, as well as expert commentary, to identify the places that make a switch to a plant-based diet easiest.
To determine the best and cheapest places for a plant-based diet, WalletHub compared the 100 largest cities across 17 key indicators of vegan- and vegetarian-friendliness. The data set ranges from the share of restaurants serving meatless options to the cost of groceries for vegetarians to the number of salad shops per capita.
| Top 20 Cities for Vegans & Vegetarians | ||
| 1. Portland, OR | 11. Cincinnati, OH | |
| 2. Los Angeles, CA | 12. Miami, FL | |
| 3. Austin, TX | 13. Atlanta, GA | |
| 4. San Francisco, CA | 14. Chicago, IL | |
| 5. Oakland, CA | 15. New York, NY | |
| 6. Seattle, WA | 16. Lexington-Fayette, KY | |
| 7. Orlando, FL | 17. Pittsburgh, PA | |
| 8. San Diego, CA | 18. Birmingham, AL | |
| 9. Madison, WI | 19. Washington, DC | |
| 10. Tampa, FL | 20. Phoenix, AZ | |
Best vs. Worst
- Scottsdale, Arizona, has the highest share of restaurants serving vegetarian options, which is 12.4 times higher than in Laredo, Texas, the city with the lowest.
- Scottsdale, Arizona, has the highest share of restaurants serving vegan options, which is 59.7 times higher than in North Las Vegas, Nevada, the city with the lowest.
- San Francisco has the most community-supported agriculture programs (per square root of population), which is 26.8 times more than in Houston, Texas, the city with the fewest.
- Atlanta, Georgia has the most salad shops (per square root of population), which is 17.15 times more than in Santa Ana, California, the city with the fewest.