This edition of Modern Restaurant Management (MRM) magazine's Research Roundup features the present and future of AI use in F&B, The Splintered Path to Purchase, the Datassential 500 Awards, and where chefs are earning six figures.
A Dilemma of “Super Size” Proportions
Amid rising food prices and shifting consumer preferences, the restaurant industry is facing a dilemma of “super size” proportions.
Quick-service restaurants maintain a steady customer satisfaction score of 79 (on a 100 point scale), while full-service restaurants — despite slipping 2 percent to 82 — remain one of the highest-rated industries in the Index, according to the American Customer Satisfaction Index (ACSI®) Restaurant and Food Delivery Study 2025. At the same time, U.S. chain sales grew just 3.1 percent in 2024 — falling short of the 4.1 percent menu-price inflation rate.
Restaurants must now navigate a razor-thin margin between maintaining customer loyalty and managing escalating costs. With households increasingly treating dining out as a luxury, every menu item and service interaction becomes a potential make-or-break moment.
“Restaurants can't simply rely on their traditional playbooks anymore," says Forrest Morgeson, Associate Professor of Marketing at Michigan State University and Director of Research Emeritus at the ACSI. "Smaller, popular brands like Raising Cane's and Wingstop are proving that creative marketing, digital engagement, and focusing on core strengths can challenge even the most established chains. The brands that succeed will be the ones that adapt quickly to shifting tastes without compromising consistency or experience.”
Among sit-down venues, steaks still reign supreme.
Last year’s co-leaders Texas Roadhouse (down 1 percent) and LongHorn Steakhouse (down 2 percent) finishfirst and second with ACSI scores of 84 and 83, respectively. Olive Garden slides 2 percent to 81.
Applebee’s inches closer to the leaders, up 1 percent to 80. Although the chain faces the same traffic challenges as much of the industry, customers seem to appreciate its “Everyday” value platform. Red Robin climbs 3 percent to 78 thanks in large part to its focus on menu and food.
Meanwhile, Chili’s, which saw average unit volumes increase 16 percent in 2024, experiences a 3 percent satisfaction drop to 78. This lower satisfaction was largely driven by its carry-out performance during spring 2024, when it began targeting McDonald’s with products and messaging.
At the bottom end of the industry, Buffalo Wild Wings sinks 4 percent to 76, and Denny’s slips 1 percent to 75.
Customers can become more critical of the quality of products and services when prices increase. This is the case with the full-service restaurant customer experience, as customer experience benchmarks decline across the board. Still, the food and service metrics are quite high. Accuracy of food order leads the way at 88, while beverage quality and waitstaff performance both score 86. The lowest ratings are related to the digital experience, which also shows the most deterioration. Website satisfaction tumbles 6 percent to 82, mobile app quality slides 6 percent to 80, and mobile app reliability plunges 8 percent to 78.
Additionally, customer satisfaction with full-service restaurants varies significantly depending on the type of purchase experience (dine in, carry out, or delivery). Customers who dine in are by far the most satisfied (despite the score slipping 1 percent to 83). However, satisfaction falls 5 percent to 79 for carry-out service and plummets 9 percent to 74 for delivery.
Chick-fil-A leads the industry for the 11th year in a row with a steady ACSI score of 83. However, the chain experiences its slowest growth in 20 years after U.S. sales only grow 5.4 percent in 2024, providing openings for popular brands like Raising Cane’s and Wingstop.
Among other chicken chains, KFC stumbles 5 percent to 77 as it faces competitors who are adapting to shifting preferences more quickly. Popeyes (up 4 percent to 75) looks to build on gains by rolling out its “Easy to Run” initiative to standardize processes, improve order accuracy, and reduce wait times.
Other notable score changes include Panda Express (up 4 percent to 80), which jumps into a second-place tie with Starbucks (unchanged). The chain’s documented emphasis on training shows in its strong performance on service quality and value. Little Caesars, up 3 percent to 77, improves ratings for food and service quality since introducing Crazy Puffs and continues its strong performance for value.
Five Guys and Sonic both falter 4 percent to scores of 75 and 73, respectively. Last-place McDonald’s dips 1 percent to an ACSI score of 70. The chain’s new efforts to speed up R&D to drive faster technology and menu changes may reverse this trend.
The customer experience for quick-service restaurants is similar to last year. Every aspect receives a score of 81 or higher. Accuracy of food order and quality of mobile app lead the way at 85, both down 1 percent year over year. Mobile app reliability is 1 percent lower at 84, matching beverage quality, staff courtesy and helpfulness, food quality, and website satisfaction (the only metric to increase in 2025).
Chick-fil-A leads in the South and West, rivals Culver’s in the Midwest, while Starbucks has the goods brewing in the Northeast
Most of the reported quick-service restaurant brands fall into one of four categories: burgers, chicken, pizza, and coffee/bakery-cafe.
Culver’s (78) leads burger chains (the largest category), followed closely by Burger King (77). Chick-fil-A (83) leads the chicken category by a wide margin. Papa Johns and Pizza Hut (both 79) share the pizza chain lead, just ahead of Domino’s (78). Starbucks (80) outperforms Panera Bread (79) and Dunkin’ (78) in the coffee/bakery-cafe chain category.
ACSI is also reporting its first-ever geographic results by region. Chick-fil-A and Starbucks show broad appeal across regional markets. Chick-fil-A leads outright in the South (84) and West (82). The chain faces stiff competition in the Midwest, however, tying Culver’s for the top spot at 82 apiece. Starbucks is a top-two performer in three of the four regions: first in the Northeast at 80, second in the South (tied with Pizza Hut at 82), and second in the West (81).
Despite improving one percent to an ACSI score of 74, the food delivery industry still lags well behind full-service restaurants and quick-service restaurants.
Customer satisfaction with the group of smaller food delivery services drops 3 percent to 77 yet still outclasses the larger brands: Uber Eats (up 1 percent to 75), DoorDash (unchanged at 73), and Grubhub (up 3 percent to 73).
Satisfaction varies based on the customer’s reason for using the service. Those looking for convenience (for example, work schedule, spending time with family, or group events) are more satisfied than those ordering due to need (e.g., health, not having a vehicle, lack of time, or not wanting to drive). Customers using the service for family time or group events generally perceive higher value. Gamers report the lowest level of satisfaction and greater frustration with the ordering process.
Although prices are still the lowest-scoring part of the food delivery experience, scores have improved somewhat, with fairness of food prices and fairness of taxes and service fees both up 3 percent to 71. Mobile app and website satisfaction improve 1 percent each to 83 and 82, respectively. Yet, while customers may find the ease of ordering (80) to be acceptable, lower scores for food temperature (up 1 percent to 74) and order accuracy and accuracy of quoted delivery times (both unchanged at 75) remain problematic.
The ACSI Restaurant and Food Delivery Study 2025 is based on 16,381 completed surveys. Customers were chosen at random and contacted via email between April 2024 and March 2025.
Restaurant AI Investments Heat Up, But Adoption Still Appears to be on the Back Burner
Deloitte examines AI adoption In its new report, “How AI is Revolutionizing Restaurants.” The survey indicates restaurants leverage AI technology to enhance customer experiences and improve operations from the dining room to the kitchen and drive-thru, yet risks and challenges remain
Among the key takeaways:
-
Eight in 10 (82 percent) restaurant executives surveyed plan to increase investments in AI technologies in the next fiscal year, and hope to see benefits for improved customer experience (60 percent), restaurant operations (36 percent), and loyalty programs (31 percent).
-
AI investments in customer experience are generating impact with 52 percent of brands and 84 percent of operators surveyed currently seeing high customer experience impact.
-
Among those surveyed, identifying the right use cases (48 percent) and managing risks (48 percent) are the top two factors holding back restaurant leaders from deploying AI.
-
Across all brands surveyed, less than half of respondents say their organizations are ready for AI adoption when it comes to strategy (43 percent), technology infrastructure (39 percent), operations (34 percent), risk and governance (28 percent), and talent (27 percent).
Deloitte examines what is driving value, perceived challenges, and organizational readiness to scale AI effectively. The report reveals that AI investment and adoption differs across the industry as organizations seek to balance experimentation with operational focus, customer-facing innovation with back-of-house transformation, and high ambitions with organizational readiness.
AI Investment Focuses on the Customer
AI has captured the interest and imagination of many business leaders worldwide, and restaurant executives are no exception. Deloitte found respondents indicated plans for AI investments, along with hopes for what such investments can help them achieve.
-
When asked how they expect their organization’s investment in AI technologies to change in the next fiscal year, 82 percent of respondents say their AI investment is likely to increase while only 2 percent expect a decrease.
-
Sixty percent of respondents cited enhanced customer experience as one of the top three benefits they hope to achieve through AI efforts, followed by improved restaurant operations (36 percent) and enhanced loyalty programs (31 percent).
-
A smaller but significant portion of those surveyed hope AI will strengthen their digital marketing efforts (26 percent), optimize food prep and waste management (25 percent), enhance crew experiences (21 percent), and help them develop new products and concepts (20 percent).
-
Benefit expectations vary by restaurant type: For example, respondents from casual dining restaurants hope to achieve a significantly greater benefit in enhancing customer experience (60 percent) compared to those in the quick service, fast casual and café segments (48 percent).
-
Regionally, differences arose. When looking at AI’s potential to enable a more positive customer experience, respondents in the U.S. and Europe are more optimistic than their counterparts in Asia (62 percent of U.S. and 59 percent of European respondents noted it as a top three benefit, compared to 42 percent in Asia). Meanwhile, respondents from Asia were the only group to cite automation/augmentation of restaurant labor as their top three hoped-for benefits (25 percent).
Adoption Is Expected to Come in Waves
Many respondents have already integrated AI into their day-to-day activities in various capacities. It may not be surprising that customer experience is leading the way given AI’s prevalence across the consumer landscape, such as in-app or in-kiosk recommendation engines.
-
Both brand and operators surveyed report that their AI investments are generating a high impact today in customer experience (52 percent of brands, 84 percent of operators) and inventory management (35 percent and 25 percent), among other areas.
-
Sixty-three percent of respondents report daily use of AI in aiding the customer experience, the most common use case. Another 26 percent say they are engaged in customer experience pilots or other forms of limited implementation.
-
The second most-common use case is inventory management, 55 percent of those surveyed cite using AI in that process on a daily basis; another 25 percent say they are testing out such applications.
-
While customer experience and inventory management represent the first wave of AI adoption, survey responses indicate that a second wave of AI deployment is focused on boosting customer loyalty and enhancing employee experience. Implementation hovers near 70 percent for these two opportunity areas (including daily use and pilots) but report planning activities indicate those numbers could soon rise.
-
A third wave includes leveraging AI in food preparation and new product development. Both applications are being used or tested in these areas by half or less of respondents today, but they also boast the highest readings when it comes to planning and development.
-
According to respondents, one of the more emerging examples is the use of voice AI in drive-thrus to automate the order-taking process.
Restaurants Using AI Still Have Multiple Challenges to Overcome
Across the commercial spectrum, companies that have adopted AI at some level report a range of challenges.
-
Managing risk around AI technology and identifying use cases tied for the top concern for organizations (48 percent), closely followed by lack of talent or technical skills (45 percent).
-
When considering the risks related to AI implementation, intellectual property issues (20 percent) and misuse of client/customer data (16 percent) were cited most often by those surveyed.
-
What doesn’t worry surveyed restaurant leaders may be just as noteworthy: Companies are not concerned with lack of executive commitment (only 20 percent of respondents said it's holding them back), choosing the right technologies (29 percent), or by computing infrastructure or data (31 percent). This suggests that restaurant executives have moved past getting leadership buy-in for AI investments and are focused on more practical considerations such as picking the right applications and finding the people to support them.
Overall AI Readiness Remains in the Prep Stage
As their plans unfold for future AI deployments, some restaurant executives say their organizations may not have foundational elements in place to scale.
-
Strategy is the only area where most respondents say their companies are “highly” prepared, although almost 40 percent say they don’t feel they have a strong strategy in place.
-
Twenty-one percent of respondents across all segments and geographies believe they have the risk and governance in place to shepherd AI investments to fruition. Meanwhile, 29 percent say their organizations are prepared in terms of technology infrastructure, and 27 percent say they are prepared in terms of talent.
-
Readiness for AI adoption varies between brands and operators. Operators report being more prepared across strategy and operations. Brands, meanwhile, have the edge in technology infrastructure readiness. Both groups have relatively low levels of confidence and readiness in terms of talent and risk and governance.
The Deloitte report is based on a survey of 375 global restaurant executives in 11 countries fielded during Q4 2024 (October - November 2024).
AI and Guest Trust
SOCi’s 2025 Consumer Behavior Index (CBI) sends a clear warning to restaurant CMOs and digital marketing leaders. Discovery has changed, and traditional digital strategies are no longer enough. While 19 percent of consumers now use generative AI tools like ChatGPT or Gemini to find businesses, a staggering 95 percent say AI is the least trusted source when it comes to making actual purchase decisions.
Consumers aren’t rejecting AI; they’re verifying it. As AI tools increasingly serve as a starting point for local discovery, consumers are looking to platforms like TikTok and Instagram to validate that what AI suggests is accurate, relevant, and human-backed. This is especially true for Gen Z, where 34 percent use TikTok and 35 percent use Instagram to discover new brands. The message is clear: AI may start the journey, but trust is earned through people.
This is not a future problem. This is today’s reality. Consumers now move fluidly between AI tools, social media, and review platforms to validate claims, check brand reputation, and watch videos from real customers before making decisions. Treating these touchpoints as disconnected strategies creates costly blind spots. With Google increasingly surfacing social content in search results, SOCi’s 2024 Local Visibility Index found that brands that lack a social-first presence are leaving millions in potential revenue untapped.
The trust-building doesn’t stop at discovery. Reviews are now the final checkpoint before conversion. An overwhelming 91 percent of consumers rely on peer-generated content to evaluate local businesses. Among younger audiences, 40 percent prefer video reviews, and 65 percent say they are more likely to choose a business that actively responds to reviews. Yet 55 percent are increasingly skeptical of fake feedback, highlighting that transparency and responsiveness are now business-critical.
Importantly, reviews are not only influential to consumers but also a key signal for AI engines (Damian Rollison, Search Engine Land). Tools like ChatGPT incorporate customer reviews as a foundational input in generating local recommendations. This underscores the dual role reviews now play in building consumer trust and shaping how businesses appear in AI-powered discovery results.
The CBI survey was conducted between February 19 and February 24, 2025, and included 1,001 adult U.S. respondents distributed evenly across gender, age, and geographic area.
The Splintered Path to Purchase
The path to purchase has splintered, and Gen Z is in the driver’s seat. According to SOCi’s 2025 Consumer Behavior Index (CBI), younger consumers are building a new model of local discovery for restaurants that is fueled by platform-hopping, peer validation, and real-time research.
Where previous generations might have turned to a single search engine or mapping app, Gen Z navigates a mosaic of micro-decisions. Their journey could begin on TikTok, continue through Reddit threads or Yelp reviews, and culminate in a Google Maps search. The traditional front door has been replaced by a dozen digital entry points, each one shaping how a brand is perceived.
“Legacy retail marketing models weren’t built for today’s buyer,” said Monica Ho, CMO of SOCi. “Gen Z is redefining what discovery looks like; they don’t follow a path, they create one. Brands that can’t meet them across platforms with authenticity and proof won’t earn their trust or their business.”
This fragmented approach to search and discovery comes with a reshuffling of trust. While search engines and navigation tools remain widely respected across age groups, Gen Z is far more likely to experiment with newer tools like AI-driven platforms while also leaning into peer-powered content. Yet despite this experimentation, they remain cautious: AI still lags behind in trustworthiness, while user-generated content on platforms like Instagram, TikTok, and Reddit plays a larger role in shaping decisions.
Brand loyalty is also on the decline. According to the CBI, nearly one-third of consumers aged 18-24, and more than a third of those aged 25-34, report being less loyal to retail brands than they were a year ago. For the youngest buyers, traditional brand reputation ranks just ninth in importance when making a purchase decision, trailing behind factors like price, quality, convenience, customer reviews, and visual content.
The CBI survey was conducted between February 19 and February 24, 2025, and included 1,001 adult U.S. respondents distributed evenly across gender, age, and geographic area.
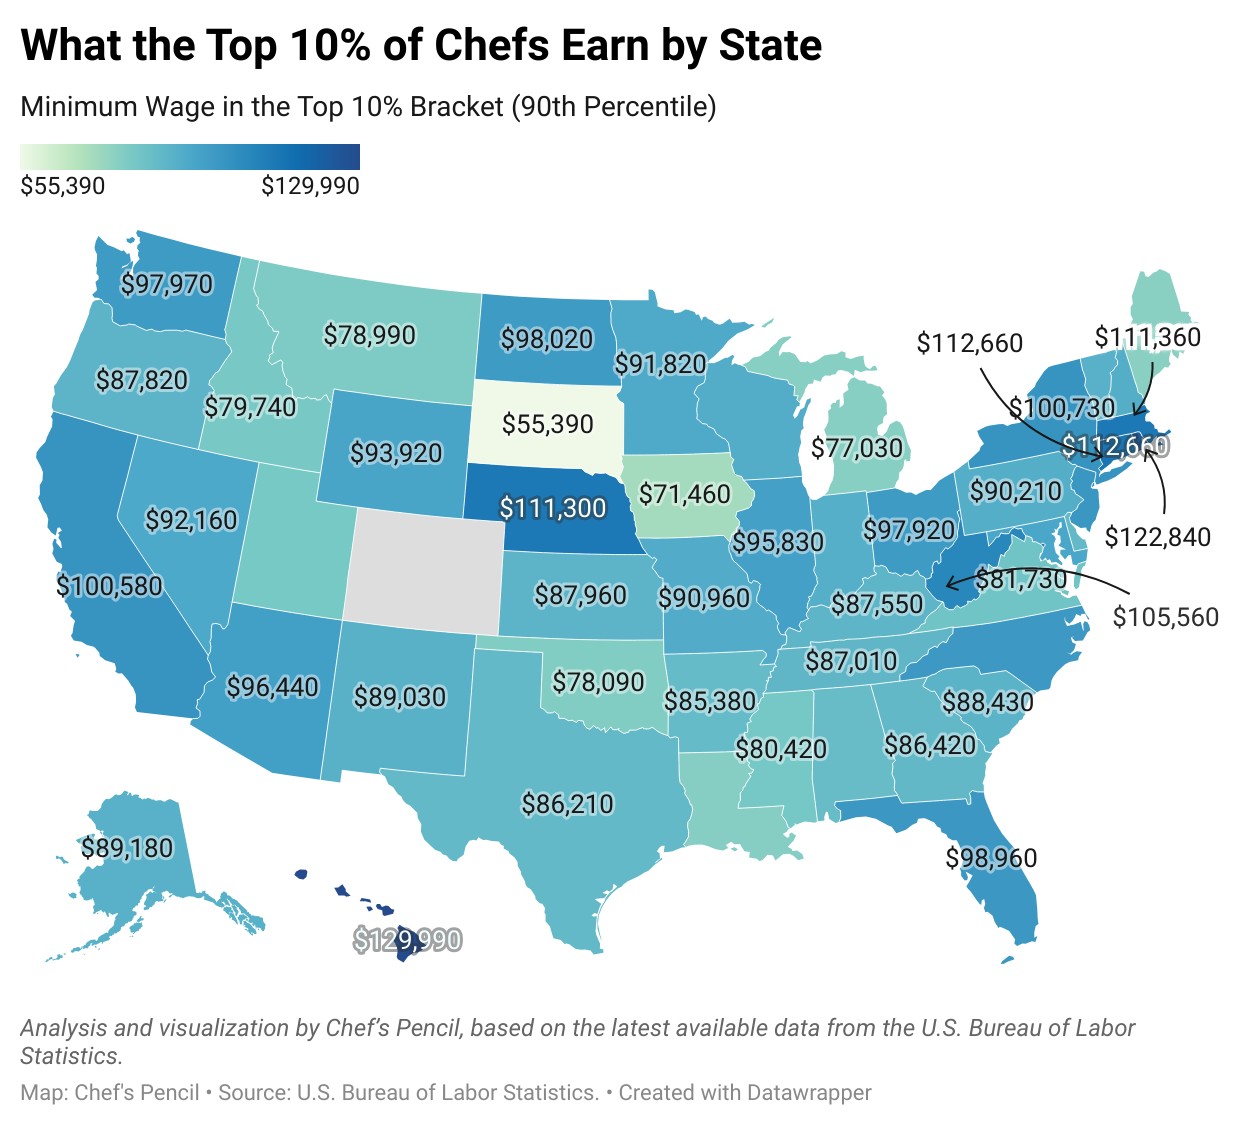
Where Chefs Are Earning $100,000
New data from Chef’s Pencil reveals where chefs are earning $100,000+
What stands out:
-
For the first time, we have a clear estimate: more than 11,000 U.S. chefs are earning six-figure salaries—offering a rare look at the true upper tier of chef compensation.
-
The metros with the highest number of six-figure-earning chefs include New York (1,651), Los Angeles (924), Boston (820), San Francisco (794), and Miami (692).
-
To spotlight where chefs earn the most, we analyzed the top 10 percent of earners in each U.S. state and metro area—ranking and mapping the top locations. Leading the list are Kahului-Wailuku, HI, where top-tier chefs make over $134,990, and Urban Honolulu, with an average of $124,880 among the highest earners.
Datassential 500 Awards
Datassential announced the winners of the Datassential 500 Awards, a first-of-its-kind recognition program spotlighting the most dynamic brands shaping the future of foodservice. The Datassential 500 blends proprietary data, predictive analytics, and real consumer sentiment to spotlight not only America’s largest and most beloved brands, but also the emerging innovators making waves across the chain restaurant landscape.
America’s Favorite Chain: Chick-fil-A
The chain has the strongest consumer ratings across all major metrics, from food quality to value and experience.
America’s Fastest Growing Chain: Hangry Joe's Hot Chicken & WIngs
The chain saw the most significant unit percentage growth in 2024.
America’s Most Craved Chain: In-N-Out
The chain that earns top marks for craveable, consistently great-tasting food.
America’s Most Unique Restaurant Menu: Crumbl
The chain rated by consumers as having the most original and innovative menu offerings.
The People’s Choice Award: Portillo’s
The chain with the highest number of devoted customers who consistently choose this brand out of loyalty and dedication, not just for convenience.
America’s Best Restaurant Experience: Texas Roadhouse
The chain that earns top ratings for great service, ambiance, and guest experience.
America’s Value Leader: Little Caesars
The chain that earns top ratings or affordability and value-for-money perception.
America’s Restaurant Innovation Leader: Outback
The chain with the strongest-performing limited-time offers and menu releases across metrics like purchase intent, uniqueness, draw and value.
America’s Best To-Go Chain: Wingstop
The chain that excels in off-premise experience, from order to doorstep.
America’s Best Burger Chain: Shake Shack
The burger brand with the strongest growth, alongside strong consumer ratings for taste and satisfaction.
America’s Best Chicken Chain: Raising Cane’s
The chicken brand with the strongest growth, alongside stellar consumer ratings for taste and satisfaction.
America’s Best Coffee Chain: Dutch Bros
The coffee brand with the strongest growth, alongside high consumer ratings for taste and satisfaction.
America’s Best in Beverage: HTeaO
The beverage-focused concept with the strongest growth and most unique, exciting drinks.
America’s Best Healthy Chain: CAVA
The chain that ranks high when consumers crave healthy, better-for-you, or plant-forward dining.
America’s Global Flavor Favorite: KPOT Korean BBQ & Hot Pot
The chain that ranks high when consumers crave international or globally-focused cuisines.
Loyalty Challenges
Circana, LLC released new research revealing that restaurant loyalty members visit 20 unique restaurant chains in a year, just as many as nonmembers. Based on an analysis of longitudinal receipt data from four of the largest loyalty programs in the United States, this finding challenges the assumption that loyalty program enrollment translates to brand exclusivity.
While loyalty members engage with multiple restaurant brands, they continue to represent a highly valuable segment for traffic growth. These consumers are heavier users of restaurants overall, making 22 percent more visits per year than nonmembers. While they don’t visit single brands exclusively, they frequent brands they’re enrolled in at twice the rate of nonmembers, allocating 8 percent of their total restaurant visits to that brand, compared to just 4 percent among nonmembers.
The research also highlights the sustained momentum of loyalty program usage. Loyalty traffic doubled from 2019 to 2024, and loyalty members now represent 39 percent of total restaurant visits. Loyalty traffic increased by 5 percent last year alone, even as overall restaurant traffic declined by 2 percent. At leading quick-service restaurant (QSR) chains, loyalty members account for half, or more, of total visits.
The rise in loyalty traffic underscores the lasting importance of these programs for restaurant operators. Loyalty programs not only help capture a greater share of visits but also generate valuable insights into guest behavior and preferences. When paired with syndicated industry and demographic data, restaurants gain the full picture, understanding how they compare to the broader market and what truly drives customer decision-making.
As loyalty program adoption grows, brands must continue investing in multi-channel engagement strategies that extend beyond the app. The app isn’t the strategy—it’s one touchpoint in a larger experience that should include tailored promotions, exclusive content, and moments of delight. The restaurant industry thrives on experiences, and a loyalty program should reflect the same sense of hospitality, connection, and delight that guests feel when they visit in person.
What's Fueling QSR and Fast Casual Visits?
HungerRush released its latest data findings that provide insights into what is driving consumers to fast casual and quick service restaurants in 2025, as well as how these types of restaurants can better meet the needs of diners. Overall, the research found that 93 percent of consumers are visiting fast casual restaurants monthly, but that doesn’t mean they aren’t without pain points. Key takeaways from the data include:
-
Long waits, order errors, and generic deals are the top reasons diners don’t return
-
57 percent of consumers prefer personalized discounts based on their order history
-
69 percent expect real-time order updates, and 51 percent would use more tech if it meant faster service
While tech matters, 38 percent still prefer ordering from human staff, underscoring the need for a seamless blend of high-touch and high-tech
Views on Tips
A new report from Instant Financial offers critical insight into how the policy could directly affect the lives of frontline workers across the country. The findings, based on a nationwide survey of 571 workers who use the Instant app to access digital tips and earned wages, highlight overwhelming support for the proposed legislation—83 percent of respondents said they want to see the policy pass.
Key findings from the report include:
- 83 percent of respondents support a No Tax on Tips policy. Just four percent opposed it, and 12 percent said they were unsure or indifferent. Support was strong across demographics and job types, reflecting a widespread desire for tipped income to be treated as untaxed take-home pay.
- 70 percent of workers are worried about inflation and rising costs. Respondents cited economic anxiety driven by tariffs, higher grocery and gas prices, and unstable housing costs—making tip tax relief feel especially urgent.
- More than 80 percent use their earned wages and tips to cover essential needs. These include rent, utilities, groceries, and transportation. Far from being extra income, on-demand wages and tips are core to meeting day-to-day financial obligations. With 65 percent of Americans living paycheck to paycheck, this should come as no surprise.
- 70 percent said they would be financially unstable without access to wages and tips before payday. This underscores the critical role of earned wage access (EWA) in helping workers manage cash flow and avoid overdraft fees, late bills, or high-interest debt.
- The median reported weekly take-home pay is $400. While averages ranged widely—from below $300 to over $1,000—the vast majority of respondents described their income as inconsistent or unpredictable, with variability tied to hours, shifts, or delivery volume.
The survey also found that while 63 percent prefer direct deposit, a meaningful number of workers favor cash, checks, or paycards, underscoring the need for payment flexibility for those who may be underbanked. The key takeaway: workers value choice, and policies or payroll systems should reflect that. According to a 2024 report from Instant, 86 percent of employees want same-day pay.
Instant Financial conducted the survey from May 29 to June 3, 2025, collecting responses from a diverse set of hourly workers using the Instant app. Participants came primarily from the food service, hospitality, and retail industries, and included servers, bartenders, delivery drivers, stylists, cashiers, and support staff. The median age of respondents was 41.
Summer Dining Dos and Don’ts Report
Resy is serving up new insights into how Americans are dining out this season - and what’s officially off the menu.
Introducing its first-ever Summer Dining Dos and Don’ts Report, Resy’s new survey of 7,500 frequent diners, reveals the latest trends, etiquette icks, and what’s shaping summer dining behavior. From fashionably late friends to phone faux pas, here’s what trending (and what’s not) at the table this summer:
● Biggest etiquette offender? The friend who’s always late. Nearly two in five adults say they have one friend who never shows up on time. More than half of diners admit to setting fake reservation times, padding them by 15 to 20 minutes, just to keep their group punctual. For Gen Z and millennials, a 15- to 20- minutes buffer is the norm.
● Different cities, different clocks: New Yorkers and Miamians are more relaxed about lateness, with nearly 25 percent saying 15 minutes late is “fine.” In contrast, diners in Atlanta, Chicago, LA and DC believe “10 minutes is pushing it.”
● Phones at the table? Gen Z says no. 40 percent of Gen Z says it’s completely unacceptable to be on your phone during dinner. In fact, 61 percent of Gen Z and millennials agree that phone use is the most awkward dinner behavior, beating out being super late or over-ordering on an even-split bill. Other Gen Z etiquette icks include rudeness to staff (76 percent) and loud talking (53 percent).
● No pay on your birthday? Half of all adults agree: if it’s your birthday, you shouldn’t have to split the bill. 44 percent of Gen Z say friends should cover the birthday guest’s meal.
● Fashionably late is out, but fashion itself is in! Half of Gen Z diners coordinate outfits before going out and 57 percent check a restaurant’s aesthetic on social media before choosing a look.
Fourth of July at Restaurants
As we gear up for the July 4 weekend, Toast shares data about how Americans celebrate the holiday at restaurants. Forget just fireworks - we're seeing clear shifts in what people eat, drink, and when they dine out.
Toast data uncovered some surprising, consumer-driven trends, showing shifting preferences and dining behaviors on a major holiday, that hints at what we can expect more of this year, e.g. a heavy lean into traditional American comfort foods and popular, easy-to-drink beverages. In 2024:
-

Hot Dogs Crowned King: Hot dog sales soared by a massive 75 percent, cementing their status as the holiday's ultimate comfort food. BBQ sales also jumped 31 percent. -

Hard Seltzers Sparkle: Despite overall restaurant sales being down, hard seltzers were the undisputed beverage star, with sales up by a whopping 40 percent! Tequila also saw a light four-percent lift, hinting at new summer drink trends. -

The Party Starts Early (and Lingers): While overall restaurant sales were down 21 percent compared to a typical Thursday, we saw early morning bar sales jump 158 percent at midnight, a clear sign of celebrations extending from the night before. Lunch hours also saw a notable lift, particularly at 2 pm (+nine percent) and 3 pm (+19 percent). -

Regional Dining Divides: New England hotspots like Rhode Island (+52 percent transactions) and Maine (+20 percent) saw significant increases, while the Midwest, notably Nebraska (-62 percent), largely opted for home-based celebrations.
Shopping Behaviors Are Shifting
A new GS1 US consumer survey found that 33 percent of U.S. adults expect to pay more for food this summer compared to last summer due to inflation and nearly half (47 percent) expect to pay the same, suggesting 80 percent report feeling no relief from high grocery prices.
With rising food costs and summer gatherings nearing, U.S. consumers are paying closer attention to food labels and seeking smarter ways to shop. The survey also showed that more than three-quarters (76 percent) of consumers want more information due to higher food costs, with 71 percent saying that they are reading labels more closely and often. Additionally, 66 percent said they would scan a QR code on food packaging to access information such as freshness, ingredients and shelf life.
“Shopping behaviors are shifting, and consumers are scrutinizing products and labels more than ever at the point of purchase to ensure they align with their preferences and budgets,” said Bob Carpenter, president and CEO of GS1 US. “Consumers want more transparency, and our digital world can provide real-time access to the information they seek. QR codes powered by GS1 are emerging on product packaging to help shoppers retrieve more-trusted real-time product details via a smartphone scan—supporting smarter, more confident decisions at the shelf.”
Through industrywide collaboration facilitated by GS1 US, brands globally are beginning their transition from the UPCs that have powered price lookup for more than 50 years to new advanced QR codes powered by GS1 that link a physical product to digital information — while still going “beep” at checkout. These smarter barcodes can offer shoppers access to detailed information directly from the brand, including origin, ingredients, synthetic dye disclosures, nutritional content, allergens, storage tips and more. Retailers have set a target date to accept QR codes at checkout by 2027, although many will be ready sooner - a GS1 US initiative labeled Sunrise 2027.
Carpenter added, “While the impetus for the transition to QR codes powered by GS1 is to support consumer information needs, industry is also envisioning many other benefits. This includes streamlining crowded packaging labels, helping facilitate recalled items, automating discounts on demand and preventing expiring products from being sold. The uses cases for QR codes on packaging are vast and continue to evolve.”
Consumer Perceptions on Foodservice Packaging
The Foodservice Packaging Institute released its third Consumer Perceptions on Foodservice Packaging Report to gain continued insight into the general consumer’s use and perception of single-use foodservice packaging. To discover those consumer perceptions and provide feedback to its members, FPI commissioned a third-party to conduct a detailed survey. This survey focused on the frequency with which people use single-use packaging and their perceptions and behavior choices related to foodservice packaging. Particular attention was given to the post-pandemic landscape amidst increasing industry scrutiny.
“The spotlight focused on single-use foodservice packaging has not waned over the past few years, and the industry faces more challenges than ever,” said Natha Dempsey, president of FPI. “We wanted to better understand consumer perceptions around these packaging products and compare them to our previous surveys conducted in 2019 and 2021. With the continued evolution of foodservice packaging and the industry, we felt the timing was right to dig into consumer beliefs.”
In the 2025 survey, participants were asked questions about their perception of potential benefits, concerns or attributes of single-use foodservice packaging items. In both the U.S. and Canada, the clean and sanitary nature of single-use foodservice packaging items, followed closely by the convenience of being able to take food on the go, was in line with the two most important benefits in 2021. The ability to see the food inside the packaging remains the least important performance attribute.
Reaffirming results from FPI’s previous surveys, respondents in both countries said being leak- or spill-proof and stopping oil or grease from soaking through and staining clothes, car seats, etc., remain the most important attributes of single-use foodservice packaging, followed closely by protection from tampering.
Results also showed that 56 percent of adults in the U.S. and 62 percent of adults in Canada use single-use foodservice packaging at least once a week. This represents a slight decrease from 2021 results for U.S. and a slight increase for Canadian respondents. Within U.S. respondents, survey results in 2025 and previous surveys show that those with the highest income remain the most likely to use single-use foodservice packaging every day, and higher education appeared to correlate with higher use.
Participants were asked questions about how frequently they use single-use foodservice packaging; their beliefs about the importance of performance attributes in single-use foodservice packaging; benefits and concerns they have about single-use foodservice packaging and their reusable counterparts; their behavior choices related to foodservice packaging; environmental issues; and, new in 2021, the influence of the COVID-19 pandemic. Each question was analyzed looking for significant differences in responses across demographic groups and frequency of using single-use foodservice packaging, and from the 2019 survey.
The final report includes input from 800 respondents in the United States and Canada, balanced across income, education level, gender and region. This sample provides a statistically representative view of the beliefs of these populations with a 95 percent confidence rate with a plus/minus 5 percent margin of error.